Have you wanted to use Drones for your earthworks as-built surveys, but been unsure about the accuracy and quality? You’re not alone. Civil Tracker’s market research shows that despite the proliferation of drones the large majority of earthworks quantity reports are still completed using conventional GPS. A few reasons this may still be the case includes: regulatory hurdles, low trust in the data, and challenges turning data into actionable information. All three of these barriers are being chipped away.
For over a decade I exclusively worked with GPS surveyed progress reports. Over the last few years I’ve been part of a team that has collected, processed and delivered thousands of drone surveys. After many many quality and accurate tests we’ve become big advocates of using drones for earthworks quantity reporting.
Drone data is still relatively new and by enlarge not well trusted. (Does anyone remember the early days of RTK GPS?) Whether your a believer in drone data or a skeptic this post explains why drone data should be trusted for earthworks progress reporting.
Understanding Manufacturer Specifications
It’s important to understand the specifications of the two tools we’re comparing.
- GPS has an accuracy of 1” (2.5cm). For example Trimble’s flagship R10 product specs are 15mm + 1PPM RMS.
- Over a distance of 1km the relative vertical accuracy is 2.5cm.
- Other manufacturers have similar specifications for their equipment.
The accuracy of drone data from photogrammetry is correlated to the ground sample distance (GSD) or resolution.
- Pix4D states that the vertical accuracy is 1-3 times GSD.
- A data-set flown with a 1” (2.5cm) GSD will be between 1” (2.5cm) and 3” (7.5cm) vertical accuracy.
- Generally anytime a range of accuracy is provided I suggest being pessimistic and use the worst case scenario.
Accuracy & RMS
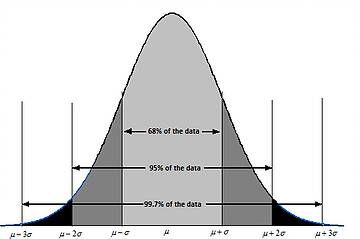
Because the accuracy of GPS is usually described as a single definitive number (25mm as I’ve published above) it’s often assumed that every GPS point is accurate to 25mm. The statistical reality is that 68% of points surveyed will be more accurate and 32% will be less accurate than the quoted RMS accuracy. This is due to random error distribution. The handy graph on the right by Cheg shows normal error distribution. The area within the lightest grey is equivalent to the RMS accuracy specified by manufacturers.
Whether using GPS or drones there are many many good practices required to achieve manufacturer specifications. We’ll them in a future post.
If used alone the RMS values lead us to believe that drone data is three times less accurate than GPS data and we should probably just continue using GPS. (Spoiler alert! There’s more to the story.)
10,000 Times More Data From Drones
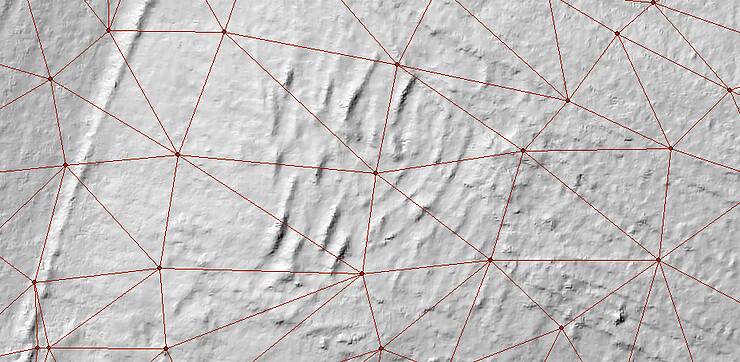
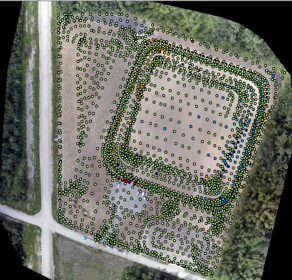
A typical GPS surveyor collects 1 point every 10 meters or 1 point per 100 square meters. Most of the Drone Data we work is 100 points per square meter. It’s pretty easy to understand the advantages of having 10,000 times more data! It’s also easy to understand that a lot of detail can be missed when only collecting 1 point every 100 square meters.
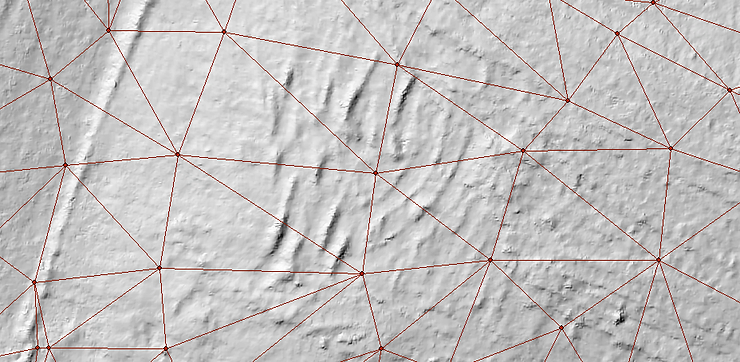
The image above shows survey points as the red dots connected via the red-line TIN. The drone data hill-shade shows just how many ground details are missed by the GPS survey. We now know we have more, but less accurate data from the drone. But the little GPS data we have is more accurate. Which is better?
Noisy Data & The Law of Averages
Many low accuracy measurements can be used to approximate the true value of something we wish to measure just as well as a few high accuracy measurements, provided there are no systematic errors in the low accuracy measurements.
To quantify this we can take the mean difference between the high accuracy and low accuracy measurements and see how far it is from zero. In the survey world, if the mean vertical difference is less than 1” (2.5 cm) then users typically claim that the drone data is ‘survey grade’. It has been shown many times that drone data achieves this when it is properly processed with ground control or high accuracy photo geotags.
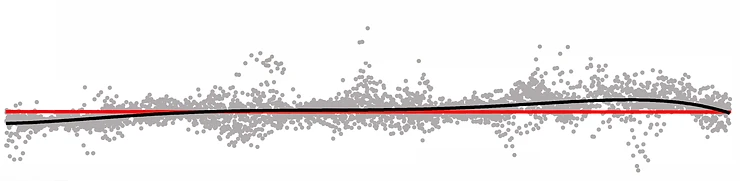
The figure above shows a drone point cloud as grey dots, a red straight line connecting 2 GPS points and the ground surface derived from the UAV points cloud as the black line.
The diagram illustrates just how good the final ground surface from the drone data is.
The drone data creates a ground surface with equal accuracy and greater detail.
Water Pit Case Study
Global Raymac Surveys has extensively tested drone data. In one test, a water containment pit was surveyed both with GPS and a drone. Approximately 3,000 GPS points were collected and compared to the UAV data. Some points were up to 20cm different. In one case the UAV point was 21cm lower than the GPS point and in another case UAV point was 20cm higher than the GPS point.
When all 3,000 points were averaged the mean was less than 1mm. When comparing the total pit volumes calculated from volume from the drone data and from the GPS survey they was less than 0.4 percent difference.
The case study area was almost entirely hard surfaces; which greatly reduced the noise and increased the accuracy of both GPS and drone datasets. Great care was taken in this case study to eliminate systematic errors. This was done by using common GPS control, coordinate systems, and completing both surveys on the same day etc. There are many many great case studies posted in various blogs that I suggest you look at for further evidence. One of my personal favorites is How I Improved by drone survey accuracy by Sam Billingsley.
Go Fly a Drone!
The next time you’re grilled on drone data accuracy for earthworks or comparing GPS vs. drone quantity reports remember the four points discussed.
- RMS accuracy is probability and statistics, not just a single number.
- Drones generate 10,000 time more data in 1/10 the time.
- Drone data is more detailed meaning less topography is missed.
- Random errors average out making drone surveys just as accurate and more detailed.
Over the coming weeks we’ll cover other aspects of drone data accuracy including: best practices for achieving absolute accuracy, understanding coordinate reference systems, ensuring sufficient redundancy to avoid blunders, various collection methodologies and the pros and cons of other sensors besides digital cameras and photogrammetry.